Flash it
Flashing is the process of moving our program into the microcontroller's (persistent) memory. Once flashed, the microcontroller will execute the flashed program every time it is powered on.
In this case, our led-roulette program will be the only program in the microcontroller memory.
By this I mean that there's nothing else running on the microcontroller: no OS, no "daemon",
nothing. led-roulette has full control over the device.
Onto the actual flashing. First thing we need is to do is launch OpenOCD. We did that in the
previous section but this time we'll run the command inside a temporary directory (/tmp on *nix;
%TEMP% on Windows).
Make sure the F3 is connected to your computer and run the following commands on a new terminal.
$ # *nix
$ cd /tmp

$ # Windows
$ cd %TEMP%

$ # Windows: remember that you need an extra `-s %PATH_TO_OPENOCD%\share\scripts`
$ openocd \
  -f interface/stlink-v2-1.cfg \
  -f target/stm32f3x.cfg
NOTE Older revisions of the board need to pass slightly different arguments to
openocd. Review this section for the details.
The program will block; leave that terminal open.
Now it's a good time to explain what this command is actually doing.
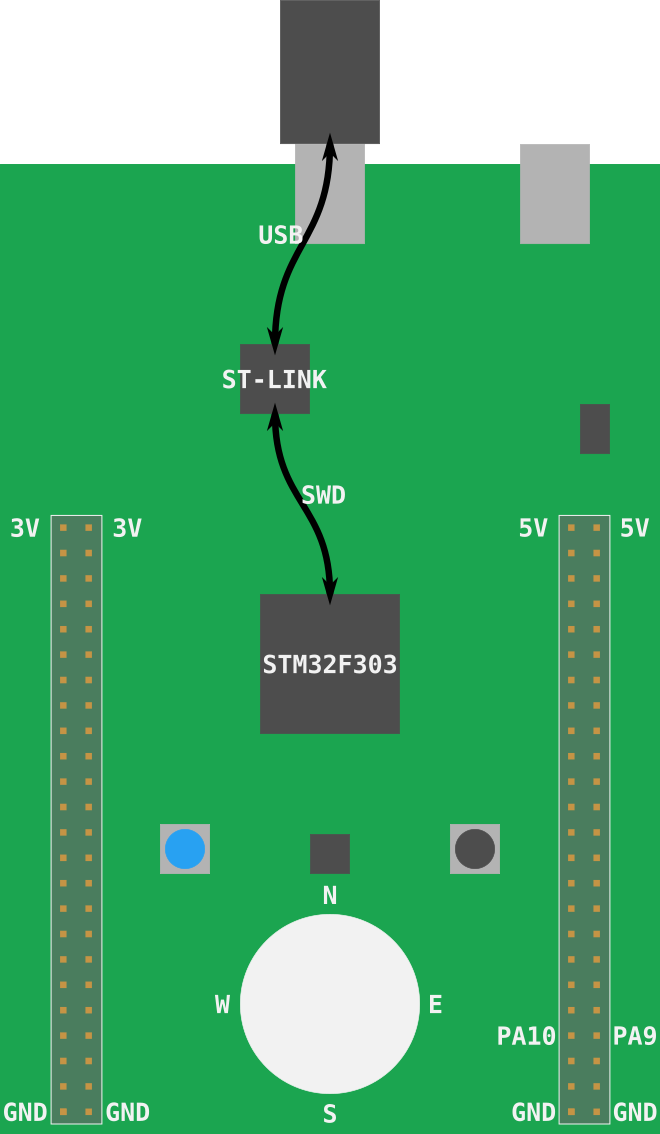
I mentioned that the F3 actually has two microcontrollers. One of them is used as a programmer/debugger. The part of the board that's used as a programmer is called ST-LINK (that's what STMicroelectronics decided to call it). This ST-LINK is connected to the target microcontroller using a Serial Wire Debug (SWD) interface (this interface is an ARM standard so you'll run into it when dealing with other Cortex-M based microcontrollers). This SWD interface can be used to flash and debug a microcontroller. The ST-LINK is connected to the "USB ST-LINK" port and will appear as a USB device when you connect the F3 to your computer.

As for OpenOCD, it's software that provides some services like a GDB server on top of USB devices that expose a debugging protocol like SWD or JTAG.
Onto the actual command: those .cfg files we are using instruct OpenOCD to look for a ST-LINK USB
device (interface/stlink-v2-1.cfg) and to expect a STM32F3XX microcontroller
(target/stm32f3x.cfg) to be connected to the ST-LINK.
The OpenOCD output looks like this:
Open On-Chip Debugger 0.9.0 (2016-04-27-23:18)
Licensed under GNU GPL v2
For bug reports, read
        http://openocd.org/doc/doxygen/bugs.html
Info : auto-selecting first available session transport "hla_swd". To override use 'transport select <transport>'.
adapter speed: 1000 kHz
adapter_nsrst_delay: 100
Info : The selected transport took over low-level target control. The results might differ compared to plain JTAG/SWD
none separate
Info : Unable to match requested speed 1000 kHz, using 950 kHz
Info : Unable to match requested speed 1000 kHz, using 950 kHz
Info : clock speed 950 kHz
Info : STLINK v2 JTAG v27 API v2 SWIM v15 VID 0x0483 PID 0x374B
Info : using stlink api v2
Info : Target voltage: 2.919073
Info : stm32f3x.cpu: hardware has 6 breakpoints, 4 watchpoints
The "6 breakpoints, 4 watchpoints" part indicates the debugging features the processor has available.
Leave that openocd process running, and open a new terminal. Make sure that you are inside the project's src/05-led-roulette/ directory.
I mentioned that OpenOCD provides a GDB server so let's connect to that right now:
$ <gdb> -q target/thumbv7em-none-eabihf/debug/led-roulette
Reading symbols from target/thumbv7em-none-eabihf/debug/led-roulette...done.
(gdb)
NOTE: <gdb> represents a GDB program capable of debugging ARM binaries.
This could be arm-none-eabi-gdb, gdb-multiarch or gdb depending on your
system -- you may have to try all three.
This only opens a GDB shell. To actually connect to the OpenOCD GDB server, use the following command within the GDB shell:
(gdb) target remote :3333
Remote debugging using :3333
0x00000000 in ?? ()
NOTE: If you are getting errors like undefined debug reason 7 - target needs reset, you can try running monitor reset halt as described here.
NOTE: If the debugger is still not connecting to the OpenOCD server, then you may need to try using arm-none-eabi-gdb instead of the gdb command, as described above.
By default OpenOCD's GDB server listens on TCP port 3333 (localhost). This command is connecting to that port.
After entering this command, you'll see new output in the OpenOCD terminal:
 Info : stm32f3x.cpu: hardware has 6 breakpoints, 4 watchpoints
+Info : accepting 'gdb' connection on tcp/3333
+Info : device id = 0x10036422
+Info : flash size = 256kbytes
Almost there. To flash the device, we'll use the load command inside the GDB shell:
(gdb) load
Loading section .vector_table, size 0x188 lma 0x8000000
Loading section .text, size 0x38a lma 0x8000188
Loading section .rodata, size 0x8 lma 0x8000514
Start address 0x8000188, load size 1306
Transfer rate: 6 KB/sec, 435 bytes/write.
And that's it. You'll also see new output in the OpenOCD terminal.
 Info : flash size = 256kbytes
+Info : Unable to match requested speed 1000 kHz, using 950 kHz
+Info : Unable to match requested speed 1000 kHz, using 950 kHz
+adapter speed: 950 kHz
+target state: halted
+target halted due to debug-request, current mode: Thread
+xPSR: 0x01000000 pc: 0x08000194 msp: 0x2000a000
+Info : Unable to match requested speed 8000 kHz, using 4000 kHz
+Info : Unable to match requested speed 8000 kHz, using 4000 kHz
+adapter speed: 4000 kHz
+target state: halted
+target halted due to breakpoint, current mode: Thread
+xPSR: 0x61000000 pc: 0x2000003a msp: 0x2000a000
+Info : Unable to match requested speed 1000 kHz, using 950 kHz
+Info : Unable to match requested speed 1000 kHz, using 950 kHz
+adapter speed: 950 kHz
+target state: halted
+target halted due to debug-request, current mode: Thread
+xPSR: 0x01000000 pc: 0x08000194 msp: 0x2000a000
Our program is loaded, let's debug it!